Mini Dow Technical Analysis Report (YM18U) Continuation.
Broadening Top Suggests Bearish Implication
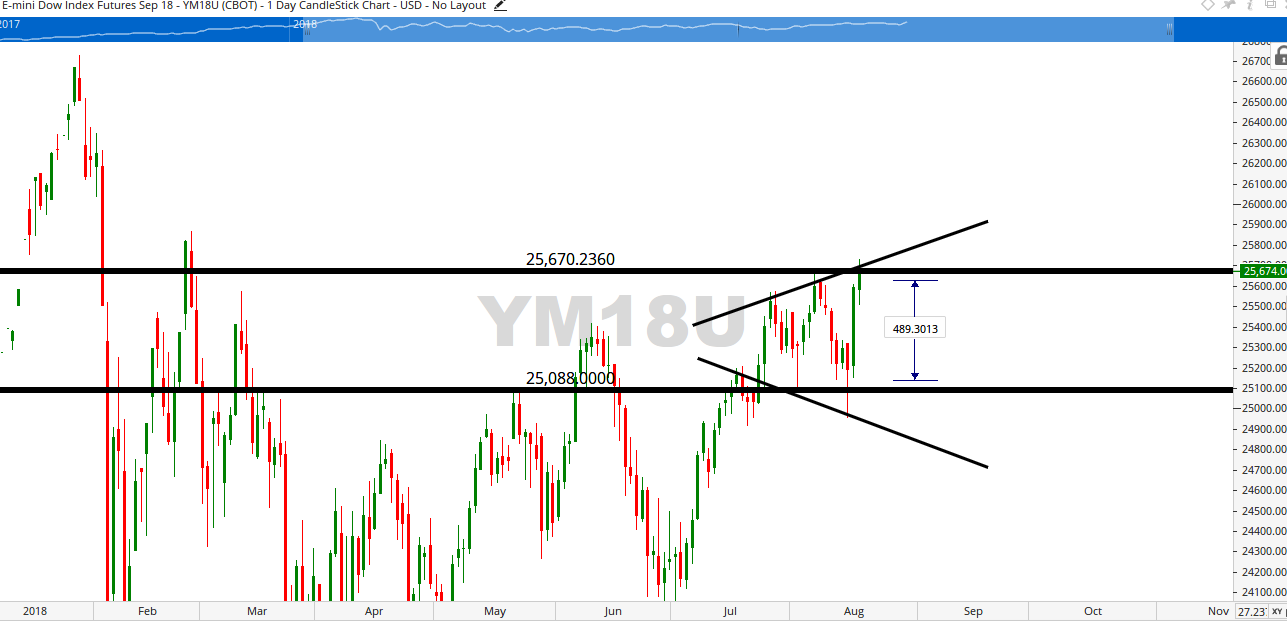
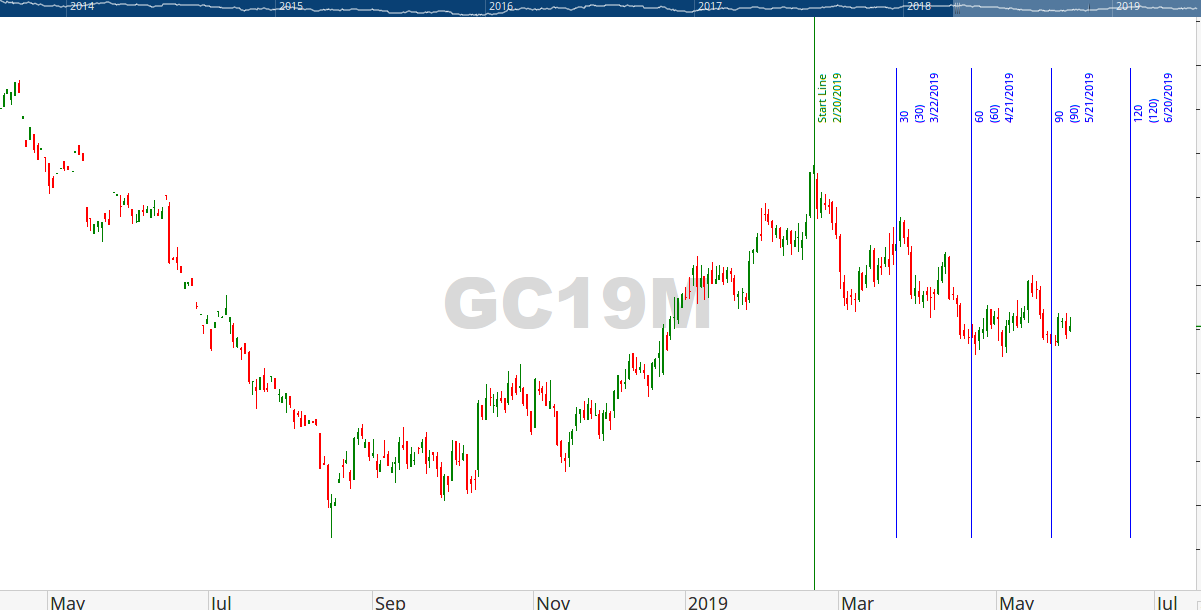
Following up on our previous look at the September 2018 E-Mini Dow, long term advances seem unattainable due to the formation of a Broadening Top Bearish Reversal Pattern.
Intraday traders can often take advantage of this situation by recognizing this Technical Analysis pattern and going short on the next day’s open. As you look at the chart you’ll notice that the September E-Mini Dow has been trading within a range of 25,670 and 25,088. Using Support & Resistance and incorporating this clear Broadening Formation into your analysis can provide you with an added layer of technical confluence and an awareness of what you can do to take advantage of the situation. Even so, volatility is at an extreme level with this pattern and a break out of this range on either side, must be taken into consideration when setting your stops.
Like what you read?
Then subscribe to our Newsletter for more Market observations and analysis!