Playing the "Gap" (GE).
Using Gaps & Volume to trade!
There are many ways, as traders, how we can determine a potential profitable trade. Among the most powerful, is to observe any “gap” in price action. A “gap” on a chart is where the price of a security increases or decreases sharply, with minimal to no trading between trading days. This dramatic move usually marks an unexpected significant fundamental or technical event; and oftentimes, this price gap is reflected in a pronounced increase in volume.
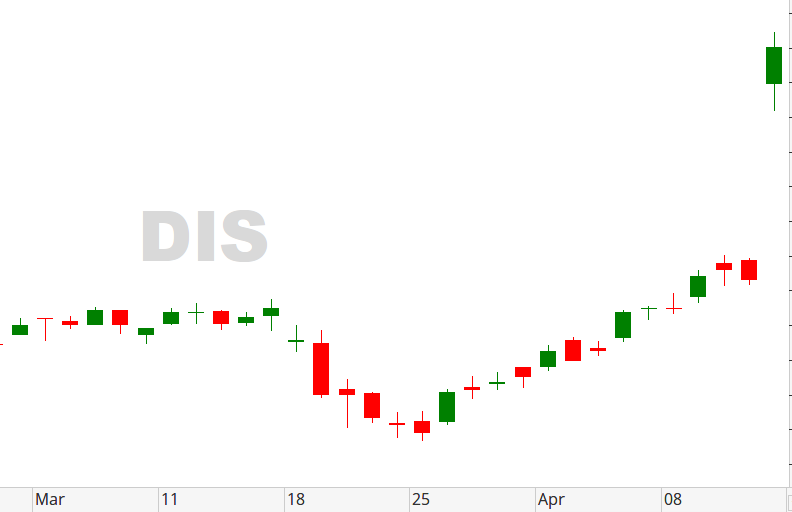
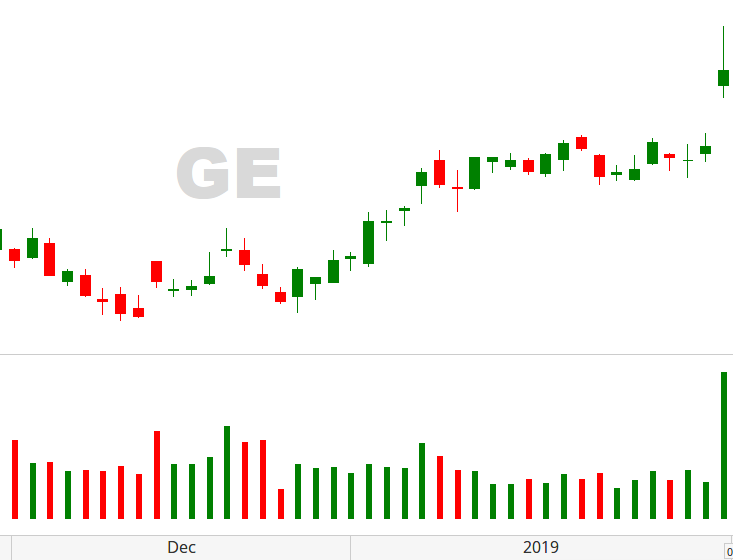
Taking a look at General Electric’s chart (GE), as of January 31st – we see just that.
(GE) had been in an uptrend since early December but has recently experienced a congestion period. This consolidation phase that had lasted for almost a month, now shows a break-away gap that also reflects a dramatic increase in volume. We can use this occurrence to “play the gap” and setup our trade to profit by this new possible uptrend! Of course, as with all trades, the question is: “How do you know where to enter the trade and where to put your stop loss – as to not lose money should this gap be filled?
I can help you answer that through consultation; contact me today!
Like what you read?
Then, subscribe to our Newsletter for more Market observations and analysis!