Mini Dow Technical Analysis Report (YM18U).
Support & Resistance in Action!
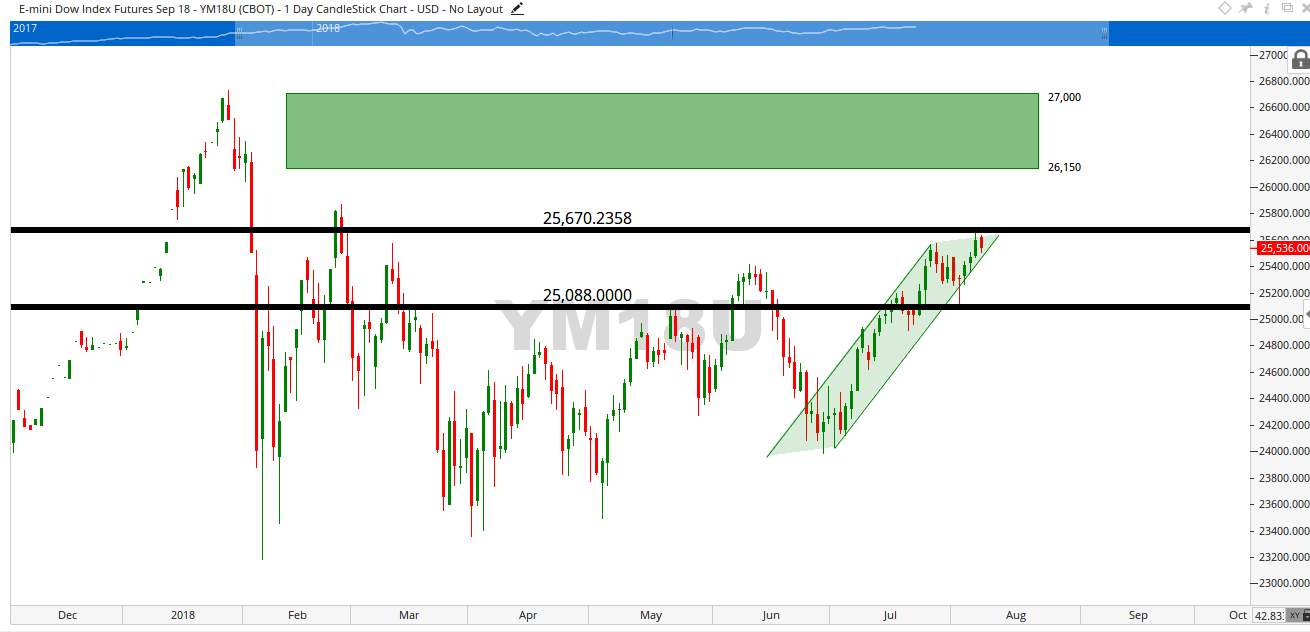
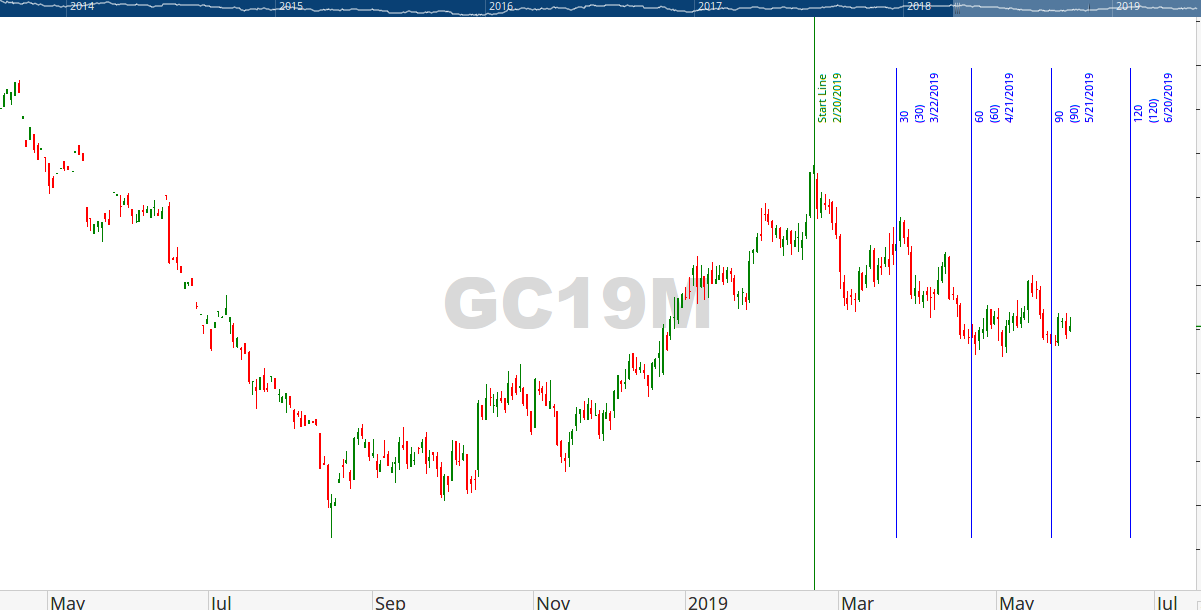
Sometimes simple Support & Resistance can provide you with potential and appropriate Market Direction for any security. Taking a look at the September 2018 E-Mini Dow Futures shows a near-term top at 25,670. Stuck in a consolidation pattern between this and an August 2nd retesting of the low on July 25th of 25,088 offers insight for your day-trading efforts.
If you look closely at the green rectangle, you’ll notice a low of 26,150 which occurred on January 31st – as well as a high of 27,000 that took place on January 29th. Using Support & Resistance techniques, you’ll observe that any continued upward momentum will offer you a target range within this rectangle. Any break in trend, should be cause for concern as a near-term target low of 25,088.
Like what you read?
Then, subscribe to our Newsletter for more Market observations and analysis!