Trading with the Relative Strength Index (MIS)
Motorola, walk the line!
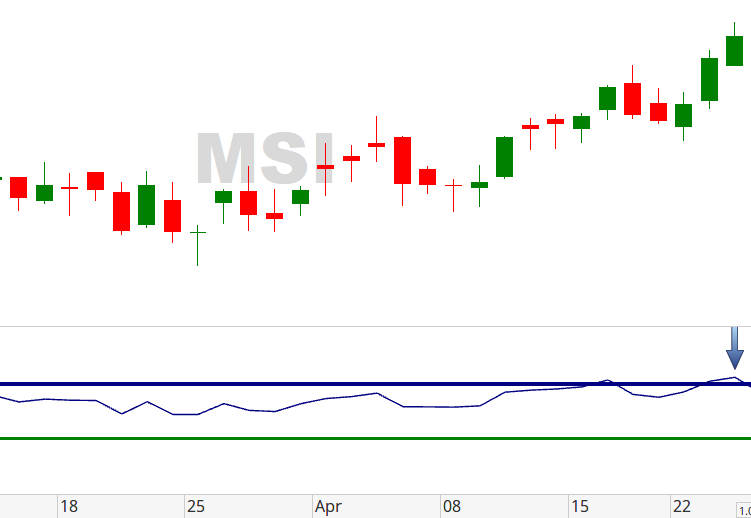
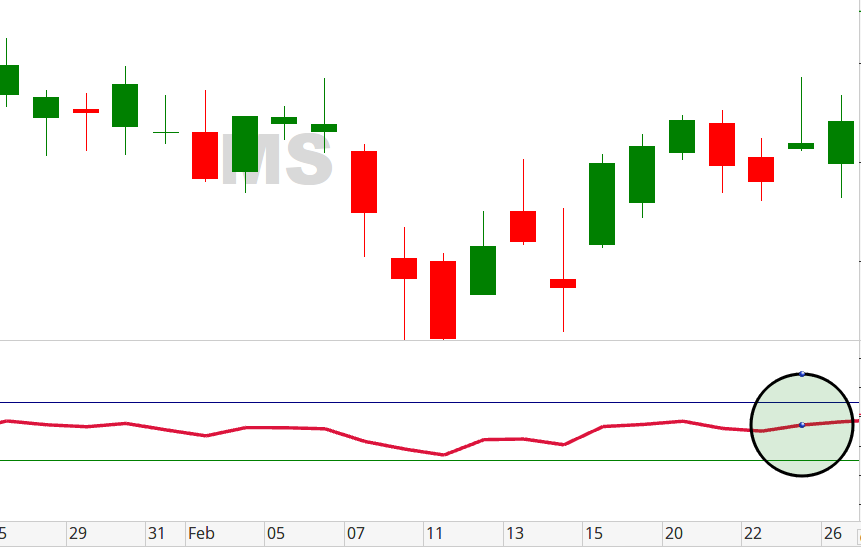
One of my favorite Technical Analysis indicators is the Relative Strength Index (RSI). It is a momentum indicator that measures the strength of past price changes to determine whether a security is overbought or oversold. That is, this oscillator moves between 0 and 100 to graphically represent if overbought or oversold conditions are present. If the RSI line value of the security, is above 70 – then it indicates that it is becoming overbought or overvalued and may be ready for a downward price movement. Conversely, if the RSI value is at or below 30, then it indicates that the security is becoming oversold or undervalued and may be ready for an upward price movement.
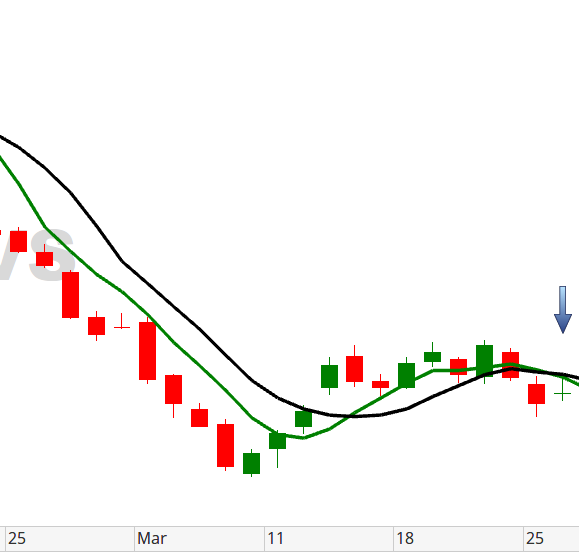
Looking at Motorola Solutions Inc. (MSI) chart, we see that the RSI has been in a steady upward trend since April 18th, confirming a Bullish trend. Keeping track of the RSI’s value is important so that we are prepared for when it changes. Understanding this, when the RSI line value crossed above 70, on April 24th, we knew that a price reversal might be coming. Being prepared to take advantage of this situation is tantamount to ensuring that we can profit from this indicator. And, as astute traders, shorting (MSI) would be the correct way to trade. Whether this results in a profitable trade remains to be seen but using the RSI gives us yet another tool to base our trading decisions.
The question remains: Where exactly do you place your trade? And, where do you exit your position to maximize profits?
I can help you answer that through consultation; contact me today!
Like what you read?
Then, subscribe to our Newsletter for more Market observations and analysis!