Ulta Beauty, Inc. (ULTA)
Fibonacci Analysis in Play!
On September 7th, 2018
– I discussed Ulta Beauty Inc. (ULTA) in our monthly newsletter. For those of you who have not yet subscribed to
this free service, please find that issue posted on our website, in the “Newsletter” section for your review. https://www.globalmarketraiders.club/newsletter
Among the many topics covered
was how Ulta Beauty Inc. (ULTA) was one of the biggest industry sector winners
of the week; and, how our analysis showed that despite superior gains near-term
projections indicated a pullback was in store, offering Day Traders with a
short-term shorting opportunity.
Indeed, this is what occurred.
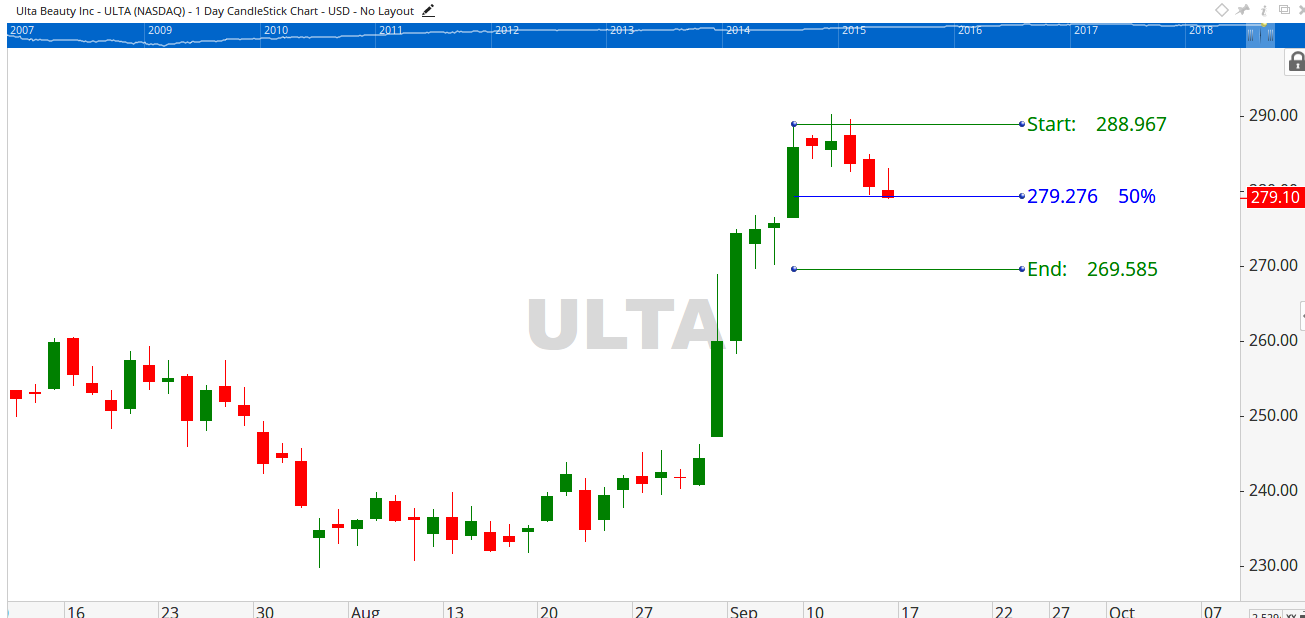
Although not mentioned in the newsletter, one of the Technical Analysis methodologies used in this projection was Fibonacci Analysis. Applying correct “highs and lows” is critical in obtaining accurate readings. And through correct application, Fibonacci levels can reveal future price action. Looking at the Ulta Beauty Inc. (ULTA) chart, target projections become amazingly accurate as you observe that the 50% Fibonacci retracement level suggested a price projection of $279.27. As of the close on Friday, September 14th, 2018 the price of Ulta Beauty Inc. (ULTA) was $279.10 – a .17¢ difference!
Like what you read?
Then, subscribe to our Newsletter for more Market observations and analysis!