Back to Basics! (AAPL) *Update
Bearish Price Channel in Action!
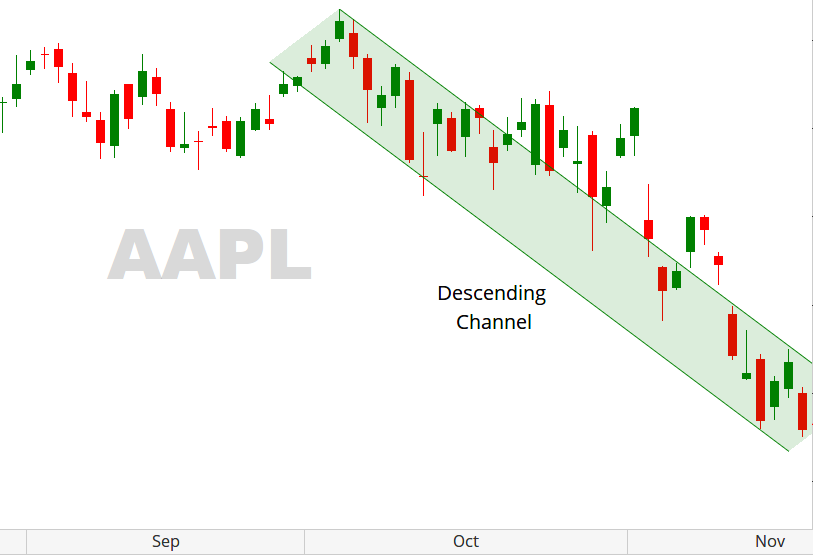
Last month we looked at Apple (AAPL) and drew a downward trendline that led us to speculate on whether an actual trend was in place. Today, I wanted to revisit Apple (AAPL) and talk about the importance of how adding a Bearish Price Channel can help validate our analysis!
A Bearish Price Channel or Descending Channel Pattern is a continuation pattern where the price of a security is not only within two downward parallel trendlines, but where prices also bounce between these descending trendlines. When traders put this into action, they can often not only trade the continuation pattern – either (Bullish Price Channel) or (Bearish Price Channel) – but also trade within these lines, since they often act as Support & Resistance.
Looking at Apple’s (AAPL) chart, you’ll see that a Descending Channel is observed and drawn. Taking a basic downward trendline from our previous analysis of (October 16th) into account, we extend this downward trendline as we create an additional parallel line that contains Apple’s (AAPL) price action. Doing so, allows us to determine boundaries for Support & Resistance as well as the ability to speculate on its continued bearish trend.
As of November 19th, we can see that in fact, a very Bearish trend is occurring. How we, as traders, respond to this is the issue. Will the trend continue? Can we rely on our analysis? And, where do we enter to achieve maximum profitability? I can help you answer that through consultation; contact me today!
Like what you read?
Then, subscribe to our Newsletter for more Market observations and analysis!